Pandas统计计算和描述
示例代码:
import numpy as np
import pandas as pd

df_obj = pd.DataFrame(np.random.randn(5,4), columns = ['a', 'b', 'c', 'd'])
print(df_obj)
运行结果:
          a         b         c         d
0  1.469682  1.948965  1.373124 -0.564129
1 -1.466670 -0.494591  0.467787 -2.007771
2  1.368750  0.532142  0.487862 -1.130825
3 -0.758540 -0.479684  1.239135  1.073077
4 -0.007470  0.997034  2.669219  0.742070
常用的统计计算
sum, mean, max, min…
axis=0 按列统计,axis=1按行统计
skipna 排除缺失值, 默认为True
示例代码:
df_obj.sum()

df_obj.max()

df_obj.min(axis=1, skipna=False)
运行结果:
a    0.605751
b    2.503866
c    6.237127
d   -1.887578
dtype: float64

a    1.469682
b    1.948965
c    2.669219
d    1.073077
dtype: float64

0   -0.564129
1   -2.007771
2   -1.130825
3   -0.758540
4   -0.007470
dtype: float64
常用的统计描述
describe 产生多个统计数据
示例代码:
print(df_obj.describe())
运行结果:
              a         b         c         d
count  5.000000  5.000000  5.000000  5.000000
mean   0.180305  0.106488  0.244978  0.178046
std    0.641945  0.454340  1.064356  1.144416
min   -0.677175 -0.490278 -1.164928 -1.574556
25%   -0.064069 -0.182920 -0.464013 -0.089962
50%    0.231722  0.127846  0.355859  0.190482
75%    0.318854  0.463377  1.169750  0.983663
max    1.092195  0.614413  1.328220  1.380601
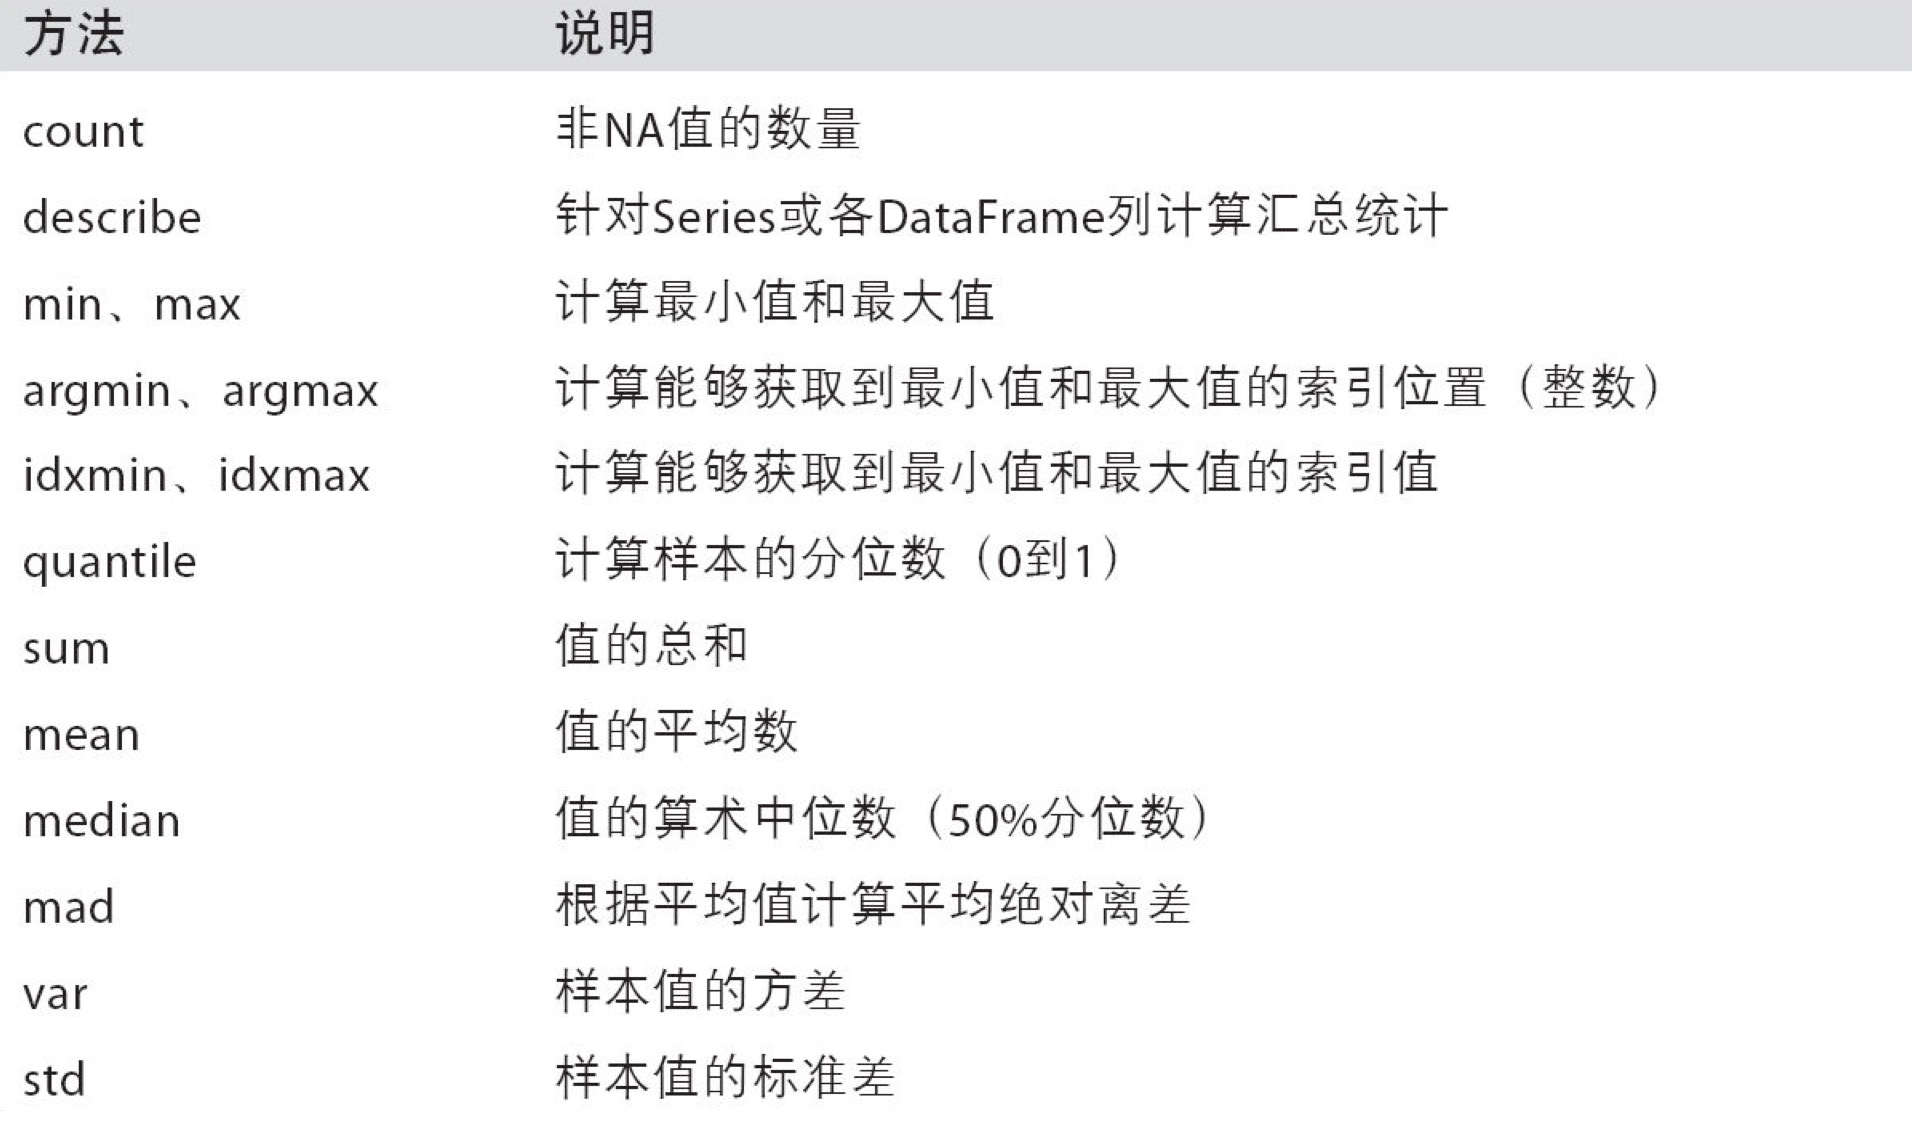
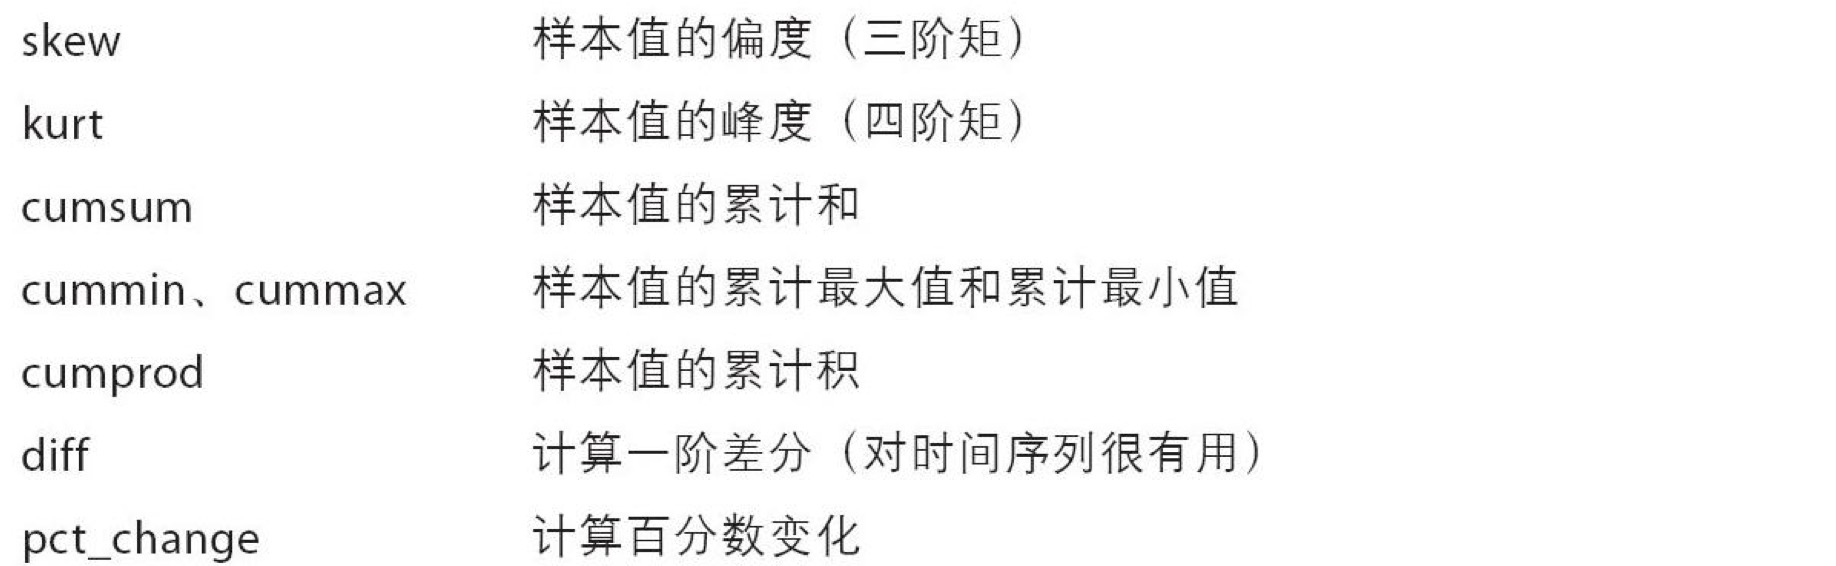
常用的统计描述方法: